
Can you guess one of the most frequently visited pages on your investor website?
It’s your share prices and charts page.
Website visit statistics from hundreds of companies show that this page is among the top 5 frequently visited pages.
Yes, investors want to see your company’s share price. They enjoy a chart showing your recent performance too.
After all, your share price is often considered as an indicator of your company’s health. It reflects investor perception of your capacity to generate profits.
As your share price increases, so does the confidence on your company’s outlook. It boosts your market value as well.
And having a low share price doesn’t mean you have to hide this information from stakeholders. A low share price might just represent a buying opportunity for some investors.
So, why not put your share price data and charts in key places on your website, like your homepage or investor centre. It will make it easy for your investors to weigh in on your business.
Following are some advantageous features on your share prices and charts to make the most of the info you deliver:
1. The latest data
Interested investors may not be sure buying your company’s stock would be a good move. So, convince them with your up-to-the-minute figures.
Give your investors in depth price data with buy/sell depth, last sale, volume, peer information, indices and maybe even historical information.
Would also be great if you could highlight dates on which the ASX Announcements were made on your share prices.
See AUB Group's share price page here for some inspiration or click the image below to visit their site.
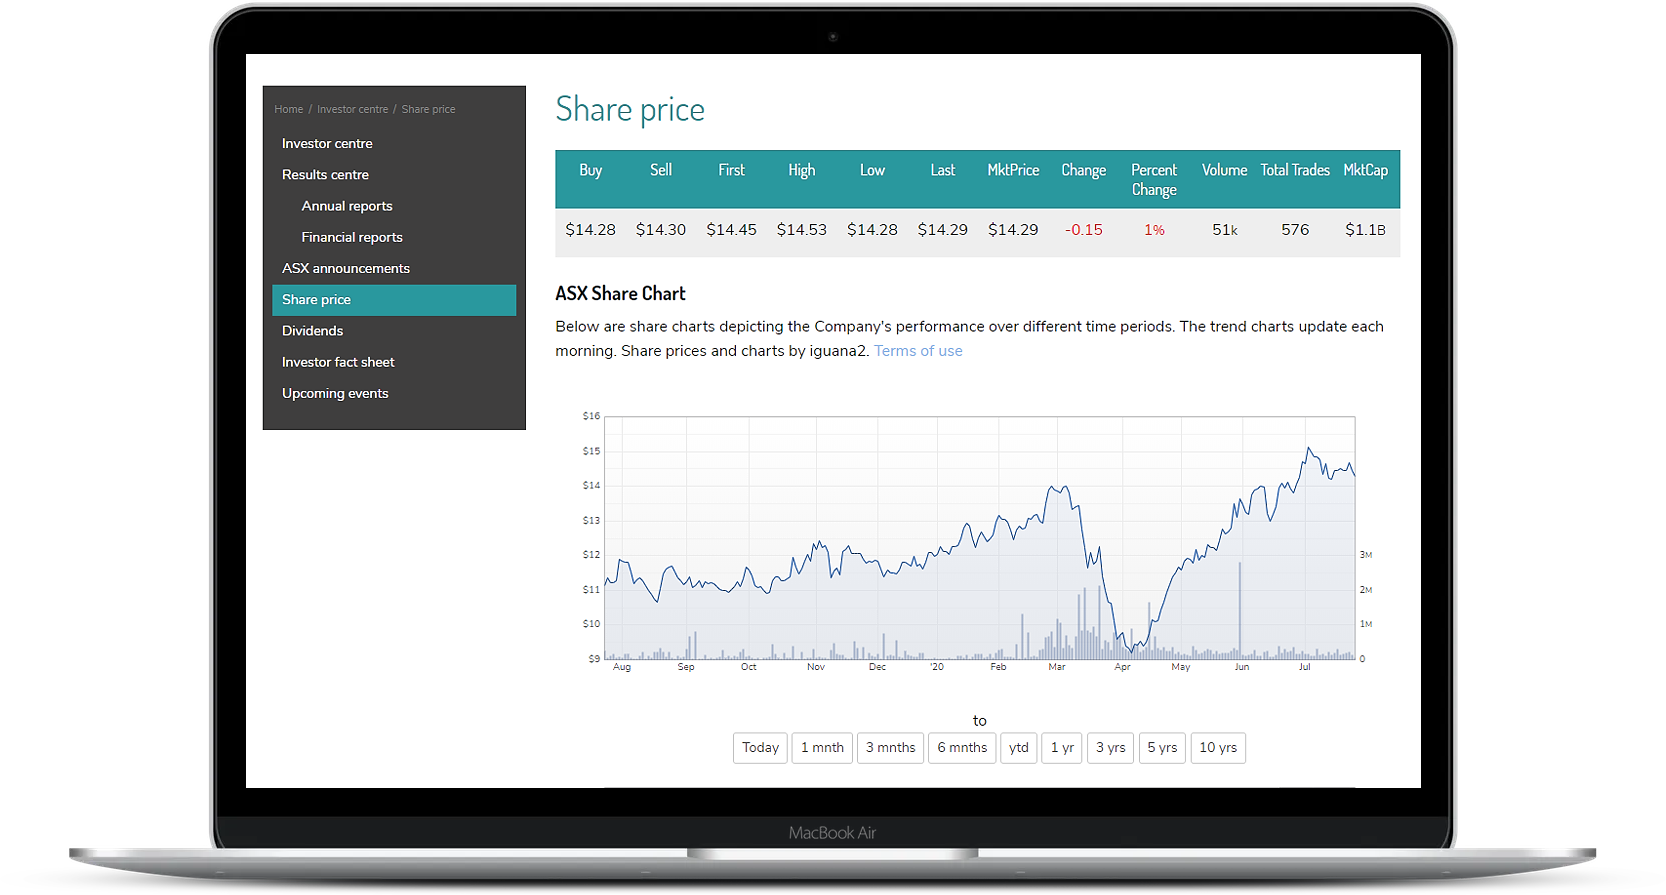 AUB Group's share price chart depicts the company's performance over different time periods.
2. User-friendly functions on your charts
Investors appreciate interactive functions that enhance their use of your share price charts. Give them an option to select the date and time range over your main chart. Or a section to add share price data from other tickers to compare with yours.
Allow your graph information to be downloadable in CSV or Excel. Or offer a calculator where they can compute the value of their shares at today’s price or at historical price points.
Head over to Amaysim's share price page here or tap the image below to see how that's done right.
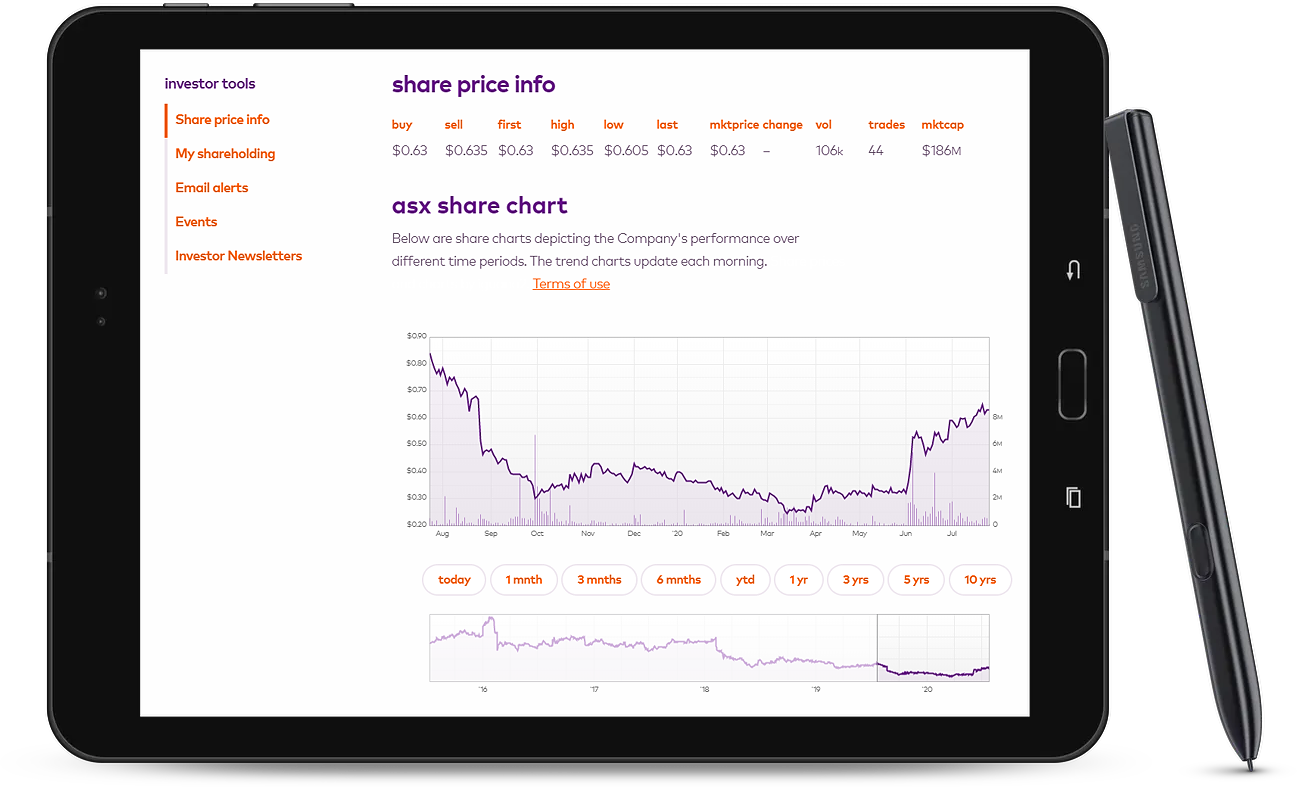 Amaysim's share price trend charts update each morning.
3. Mobile accessibility
Chances are your investors are never far from a mobile phone or tablet. Make sure your share prices and charts are quickly available within your mobile-friendly website.
It won’t matter how updated your share prices are or how smooth your charts function if your website won’t work on both desktop and mobile devices.
Check out REA Group's great example here or click the image below to go to its web page.
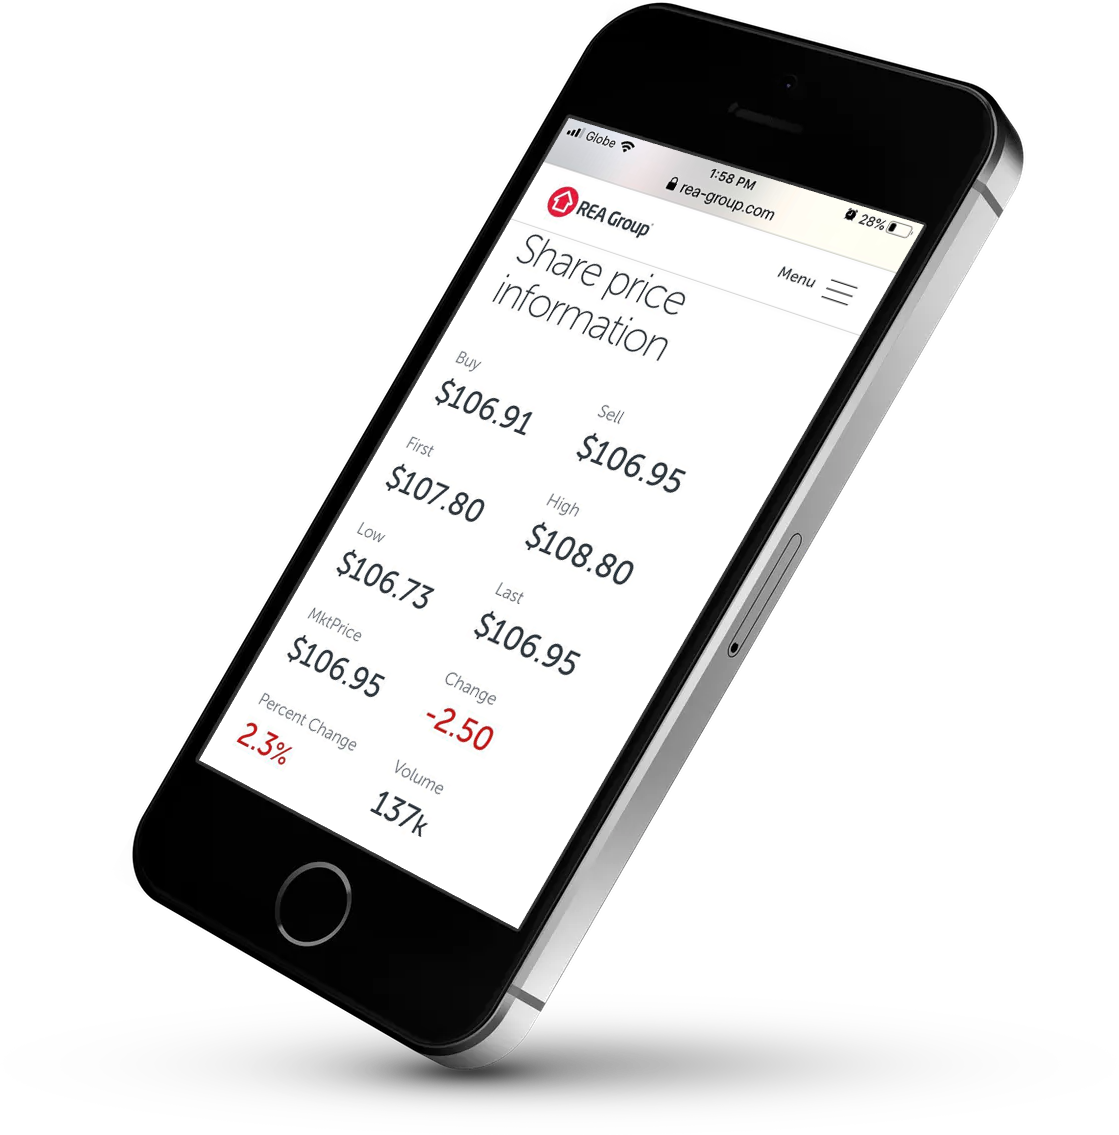 REA Group’s share price info can be easily accessed on mobile devices.
So…
Want your share prices and charts to stand out? You’ll need to provide investors the latest data, user-friendly functions as well as mobile accessibility. With these features, you’re setting the stage for investors’ favourable decision towards your company.
A little help on your share prices and charts?
With IRM, it’s now really easy to implement share prices and charts on your website. Whether you have a website built on our HQi content management system or on another platform. Our share prices and charts are customisable and seamlessly integrated into your website.
A lot of our 170 clients highlight their share prices and charts on their sites. Check out some examples of our work through this link.
If you’d like to discuss options or request a quote, our account managers would be happy to assist you. Please call on +61 2 8705 5444 or email clientrelations@irmau.com.
Editor's Note: This post was originally published in February 2018 and has been updated for accuracy and comprehensiveness.

 Online Investor Engagement Specialists


